

Sustainability Pays - How LCA Finds Costs and Risks in Your Supply Chain
-opt-2500.WEBP)
Supply chains break more often than they used to, and those breaks are no longer something a company can wait out. They are a cost to plan around. Disruptions cost businesses about $184 billion a year, and 65% of companies face at least one bottleneck somewhere in their supply chain. Weather disasters big enough to cause a billion dollars of damage hit about every three weeks, four times as often as in the 1980s. Trade rules keep shifting too, and in one year tariffs reshuffled more than $400 billion in global trade flows.
The design phase is the decision window.
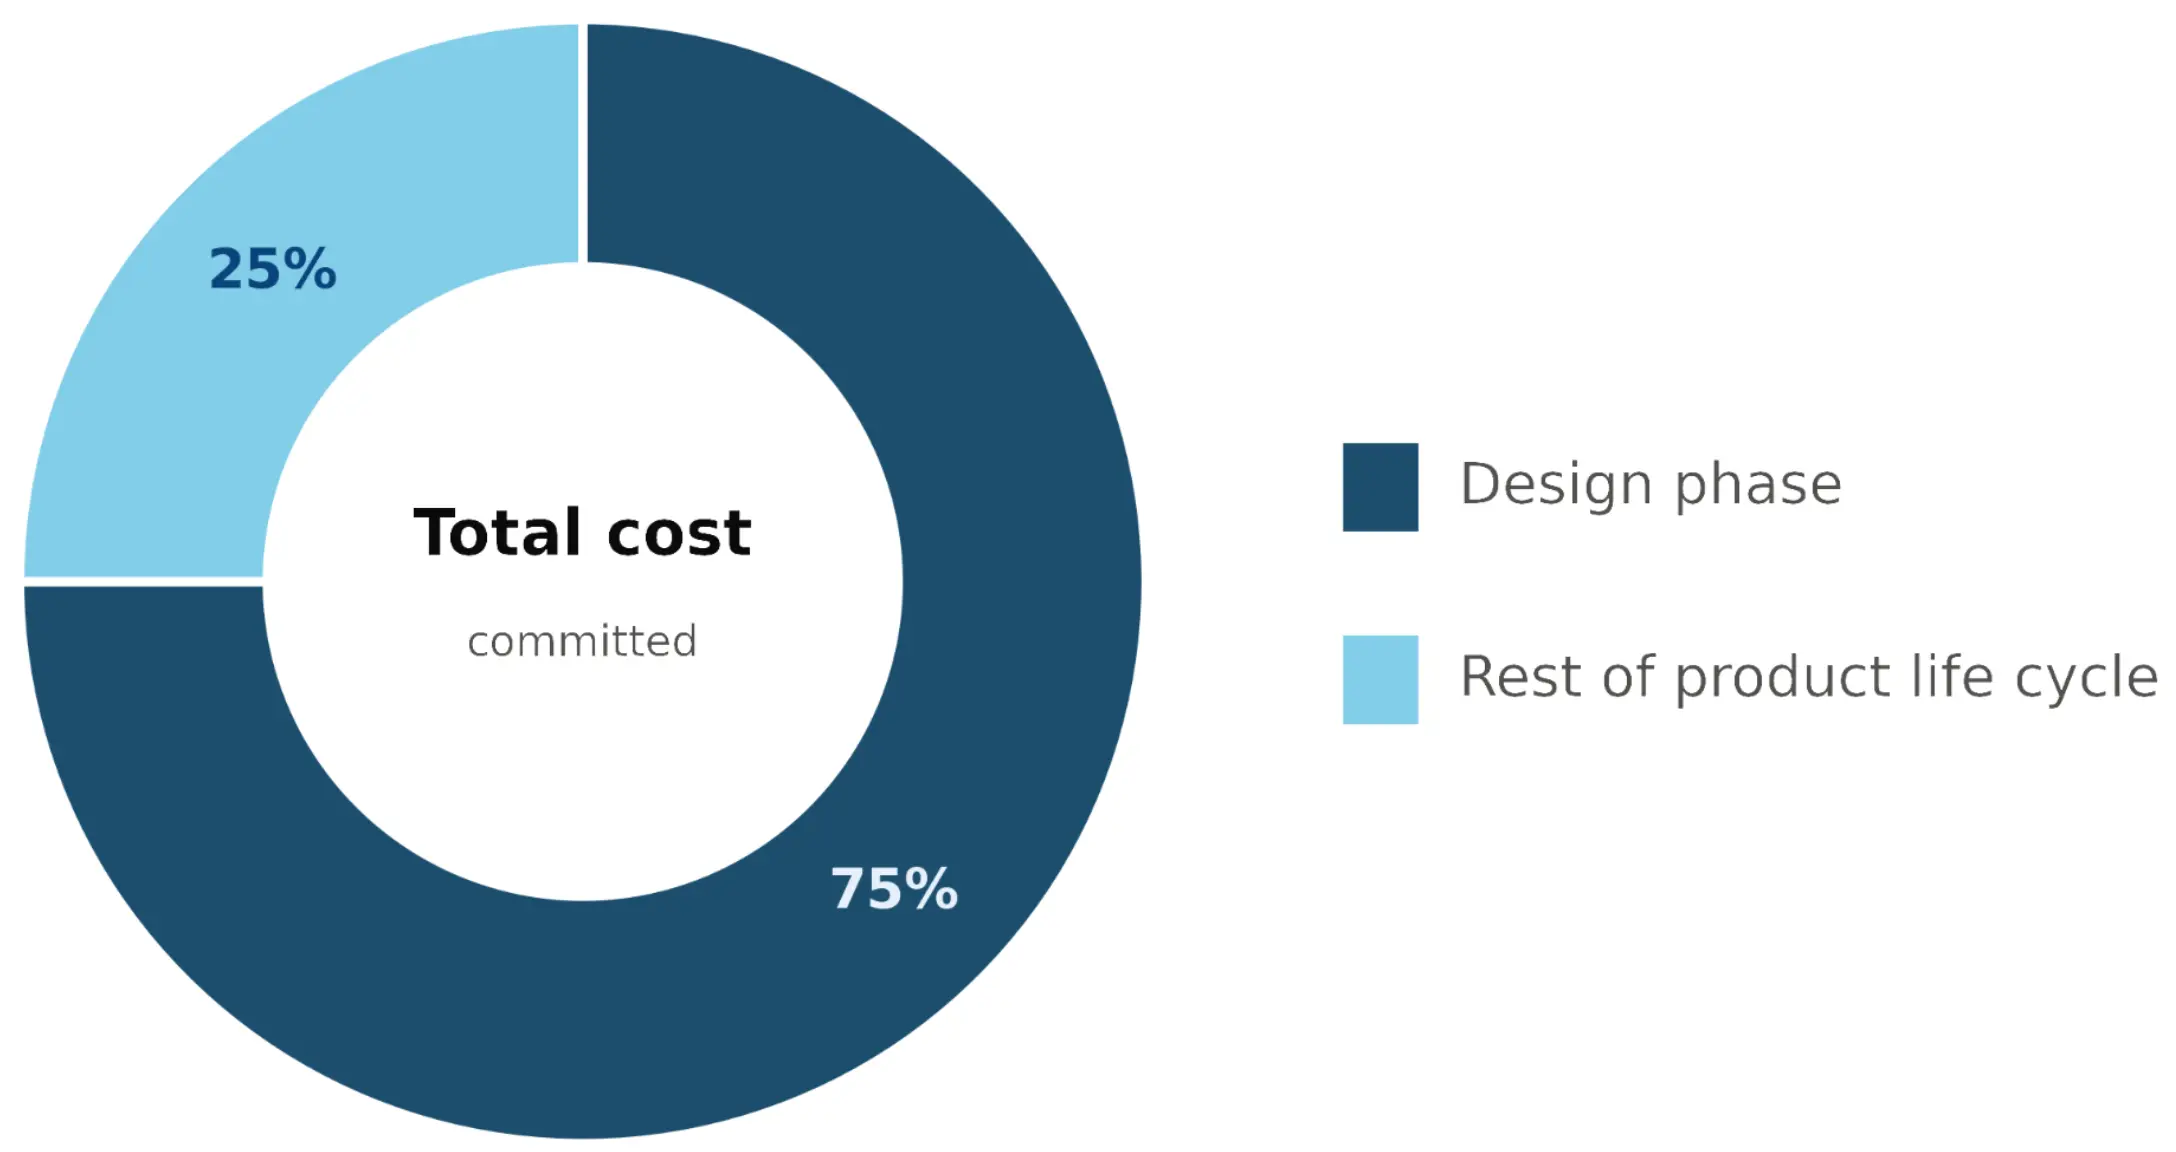
For the people who have to choose materials and suppliers, this volatility hits at the worst possible time. Around 75% to 80% of a product’s cost is locked in during the design phase. Once production begins, changing materials or suppliers becomes harder and more expensive, so the decision has to hold up before a plant is running, a contract is signed, or a customer is asking for proof.
What a Life Cycle Assessment Measures
A Life Cycle Assessment (LCA) measures a product’s sustainability and technical performance across its life: pulling raw materials from the ground, making the product, shipping it, using it, and throwing it away. The method is set out in the international standards for LCA, ISO 14040 and ISO 14044. Two terms matter for a strong, defensible LCA. The functional unit is the measured amount of product that results get reported against, such as one tonne of pellet or one megajoule of fuel. The system boundary is where the analysis starts and stops. Comparing two products means checking that they used the same functional unit and the same system boundary. Otherwise, the comparison is inaccurate. Products measured against different amounts, or across different parts of their life, produce numbers that look alike without describing the same thing.
Finding Hot Spots
Building an LCA means building a list first. It records every material bought, every unit of energy burned, every mile shipped, and every pound of waste thrown out. The final number is what companies share with customers and investors, but the list underneath it is the real prize, because it shows a company its hot spots.
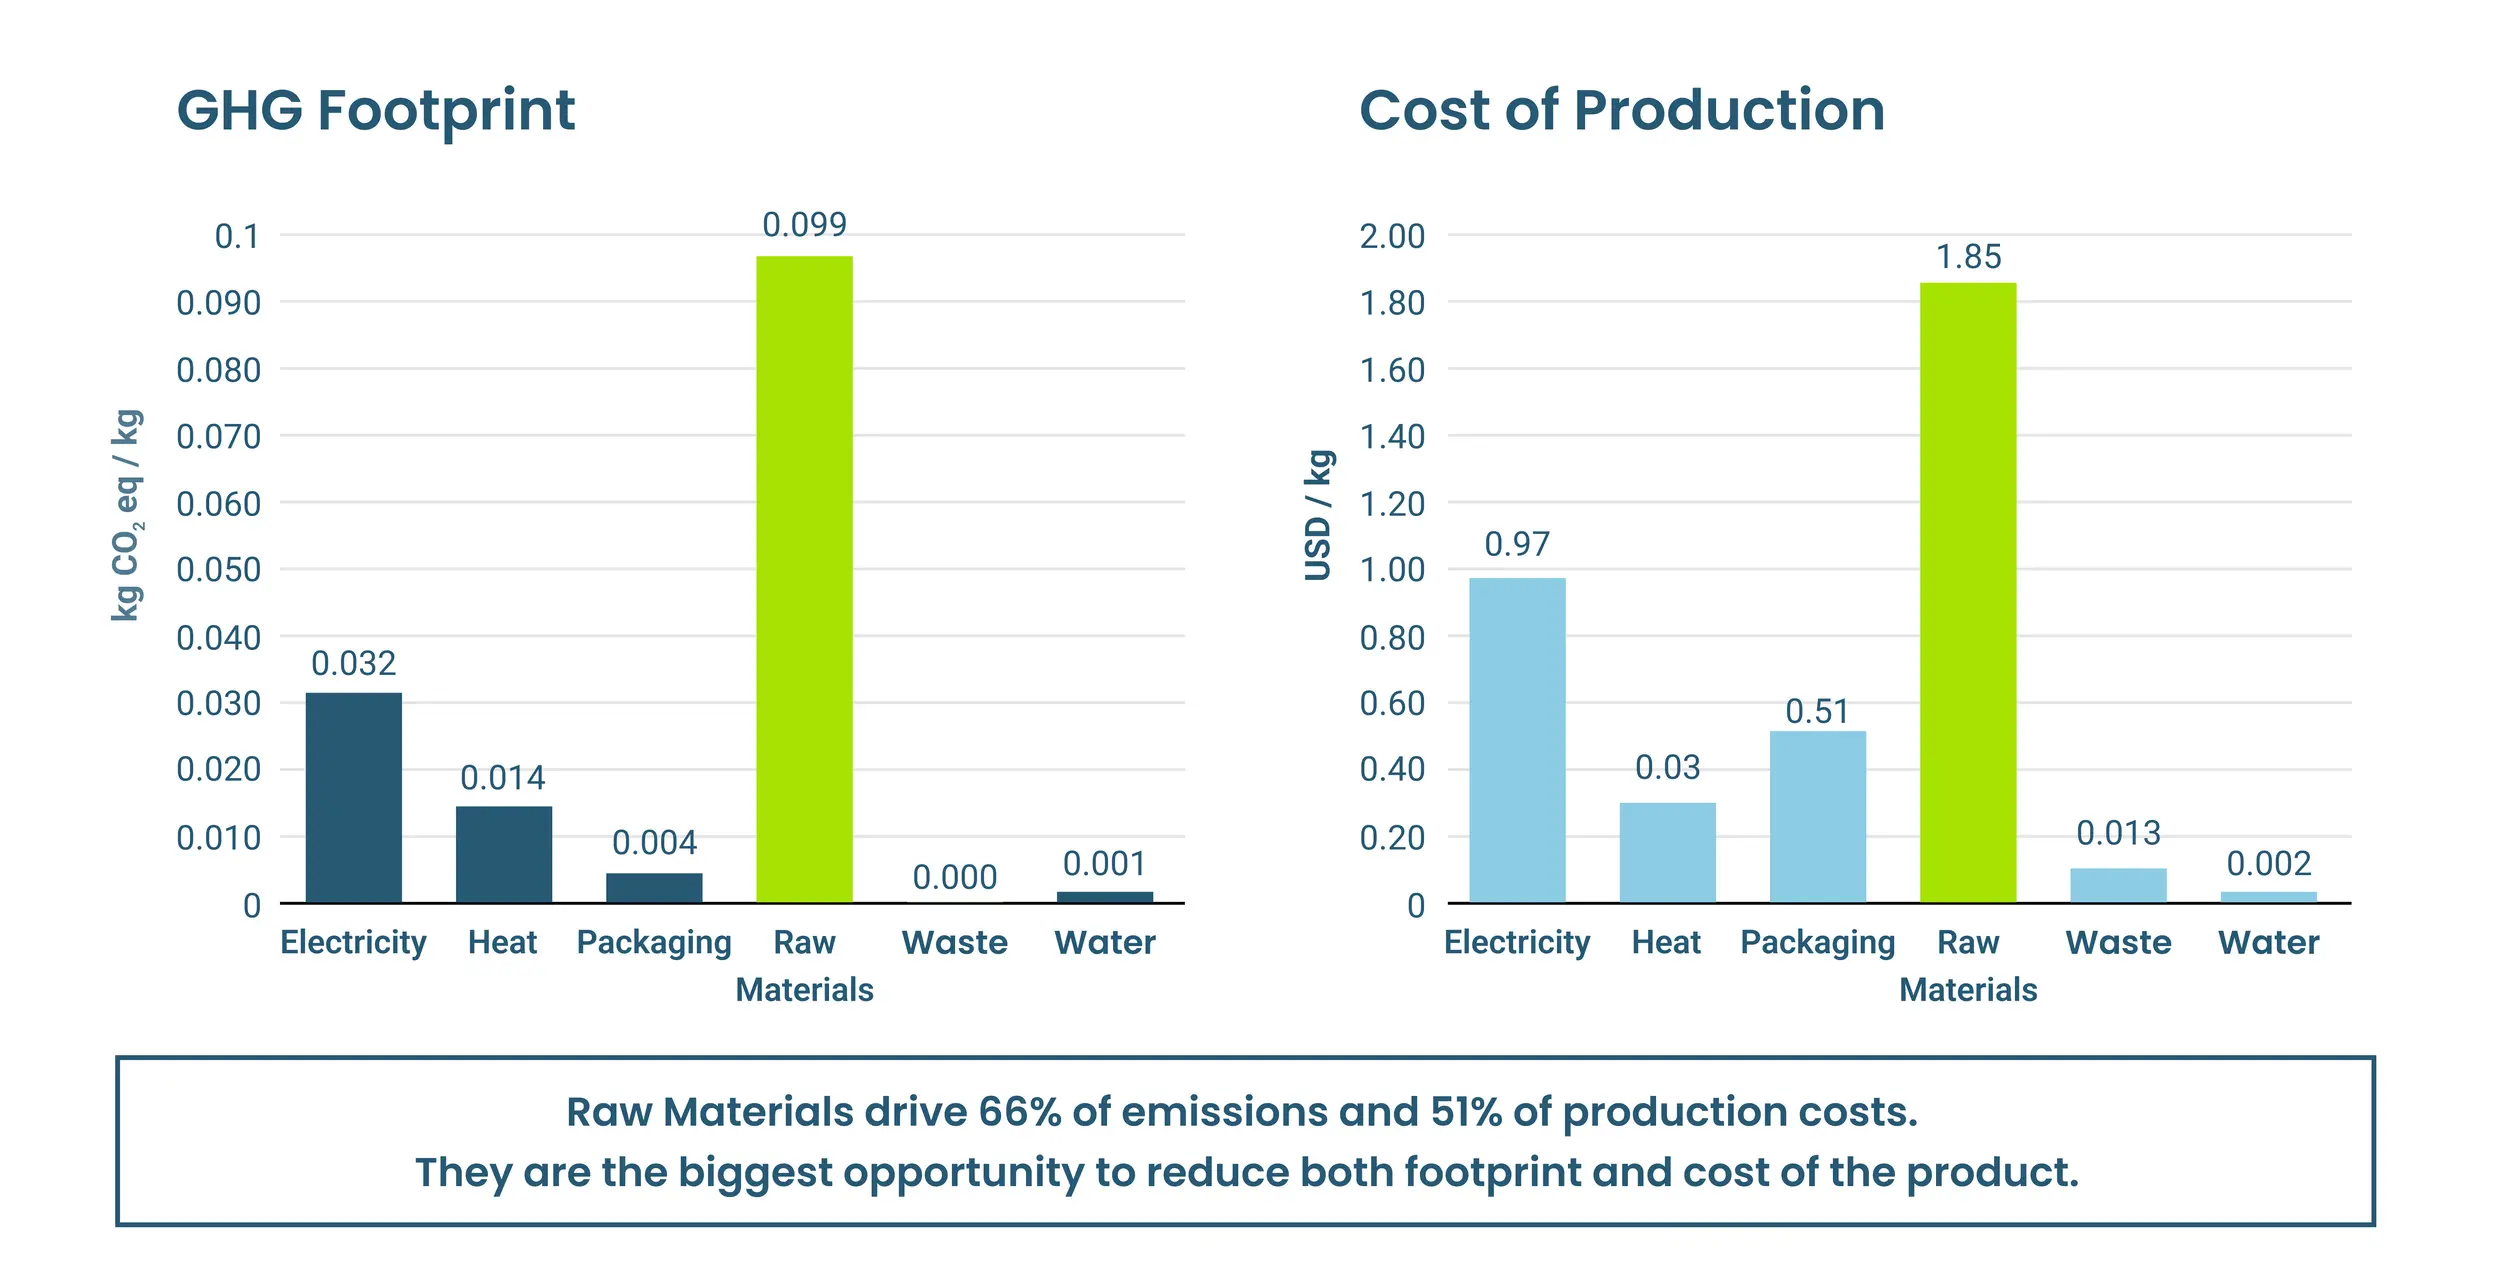
A hot spot is the stage of a product's life that accounts for a negative environmental impact that is disproportionate to the product’s overall sustainability footprint. Because it carries so much of the total, even a modest improvement can make a meaningful difference. The hot spot is often not where the team expects it, as a familiar concern may be minor while a less visible stage is driving both sustainability and cost performance. These unexpected results from LCAs often point to changes that can reduce both cost and sustainability footprint at the same time.
-opt-2500.WEBP)
What Can Be Done About A Hot Spot
Once a hot spot has been identified and priced, the product’s LCA inventory (the record of materials, energy, transport, waste, and related costs) can be adjusted to compare various scenarios.
Each scenario moves sustainability, cost, and risk at the same time, so comparing them requires assessing all three the same way: using the same functional unit and the same system boundary, meaning the same measured amount of product and the same start and end points for what counts as its entire life. Options assessed on different units of measure cannot be ranked. These comparison requirements have to hold for all other products and technologies that are compared against each other.
The Questions Keep Coming
An LCA describes a supply chain on the day the data was collected. A new supplier, higher production volume, a reformulation, or a change in the regional electricity mix can alter the model’s material, transport, energy, and cost inputs. Whether the change is planned or outside the company’s control, the earlier LCA may no longer describe the product being sold. This is where a dynamic LCA becomes important. If conditions often change within a year and a company’s supply chain data needs to remain current enough to answer the next material, supplier, or operating question, a dynamic LCA would be a better choice.
A dynamic LCA does not require a company to repeat the full assessment after every small change. Instead, the company has the flexibility to update materials, suppliers, transportation distances, or electricity mix and rerun the model. This keeps the analysis useful for ongoing decisions without commissioning a new 4- to 12-month study each time.
Where Boundless Makes a Difference
Boundless built LifeCycle IQ for this kind of model. The platform combines product-level LCA and cost analysis under ISO 14040 and ISO 14044, with models reviewed by verified, independent researchers alongside our team. Its scenario tools compare changes within a product’s supply chain, across products, and against industry benchmarks. Each industry-specific model draws on Boundless’ rigorous industry benchmark database covering more than 400 industries and verified third-party LCA data. As suppliers, materials, or volumes change, the model can be updated and rerun, providing evidence for external stakeholders and decision data for internal teams.
The Takeaway
Finding a hot spot rarely requires new data. The numbers usually sit in purchase orders, power bills, and freight invoices already. An LCA sorts them by life cycle stage instead of by department, and the concentration becomes visible. Cost and sustainability performance are not two separate reports. They move together, and a model built to show both at once finds savings and risk that a cost review alone walks straight past.
The full white paper works through the same analysis in depth, including how to weigh options on equipment cost, running savings, and sustainability footprint inside one model.
A LifeCycle IQ demo shows where cost and sustainability performance can converge for your specific products.


