

Sustainability Pays: How LCA Finds Cost and Risk in Your Supply Chain
Somewhere in your supply chain, money is leaking. It might be an energy-hungry process, a material that travels too far, or a supplier your product depends on more than anyone realized. Most teams find these problems late, after the contract is signed or the customer starts asking questions. Most companies already own the tool that catches this early. They call it the Life Cycle Assessment.
A Life Cycle Assessment (LCA) is usually treated as a reporting exercise. A customer asks for proof of a sustainability claim, the study gets done, and the results go into a folder. That treatment leaves most of the value behind. The same analysis that measures your product's sustainability footprint also maps where cost and risk concentrate across your supply chain.
Held one way, an LCA is proof for the outside world. Turned over, it is an inside view of your own operations, with the costly parts marked.
The Map Hiding Inside Every LCA
An LCA tallies a product's sustainability impact across its whole life, from the raw materials pulled from the ground through manufacturing, transport, use, and disposal. That full span is called cradle-to-grave. The international standard for LCA, ISO 14040/14044, sets the method, and it demands a complete inventory: every material purchased, every unit of energy consumed, every kilometer traveled, every unit of waste, stage by stage and supplier by supplier.
Look at that inventory again. Every line in it is something your company pays for. To measure a footprint, the assessment has to build the exact picture of your cost structure that most companies have never assembled.
The sustainability footprint number gets the attention. The inventory behind it is a working map of your operations, and that map is where the value lives.
Finding Costly Hot Spots
In every product's life, a small set of stages carries most of the burden. An LCA finds them. Practitioners call these hot spots, and they rarely sit where teams expect them. What draws the most attention internally is rarely what drives the sustainability performance. The real source is usually something nobody flagged.
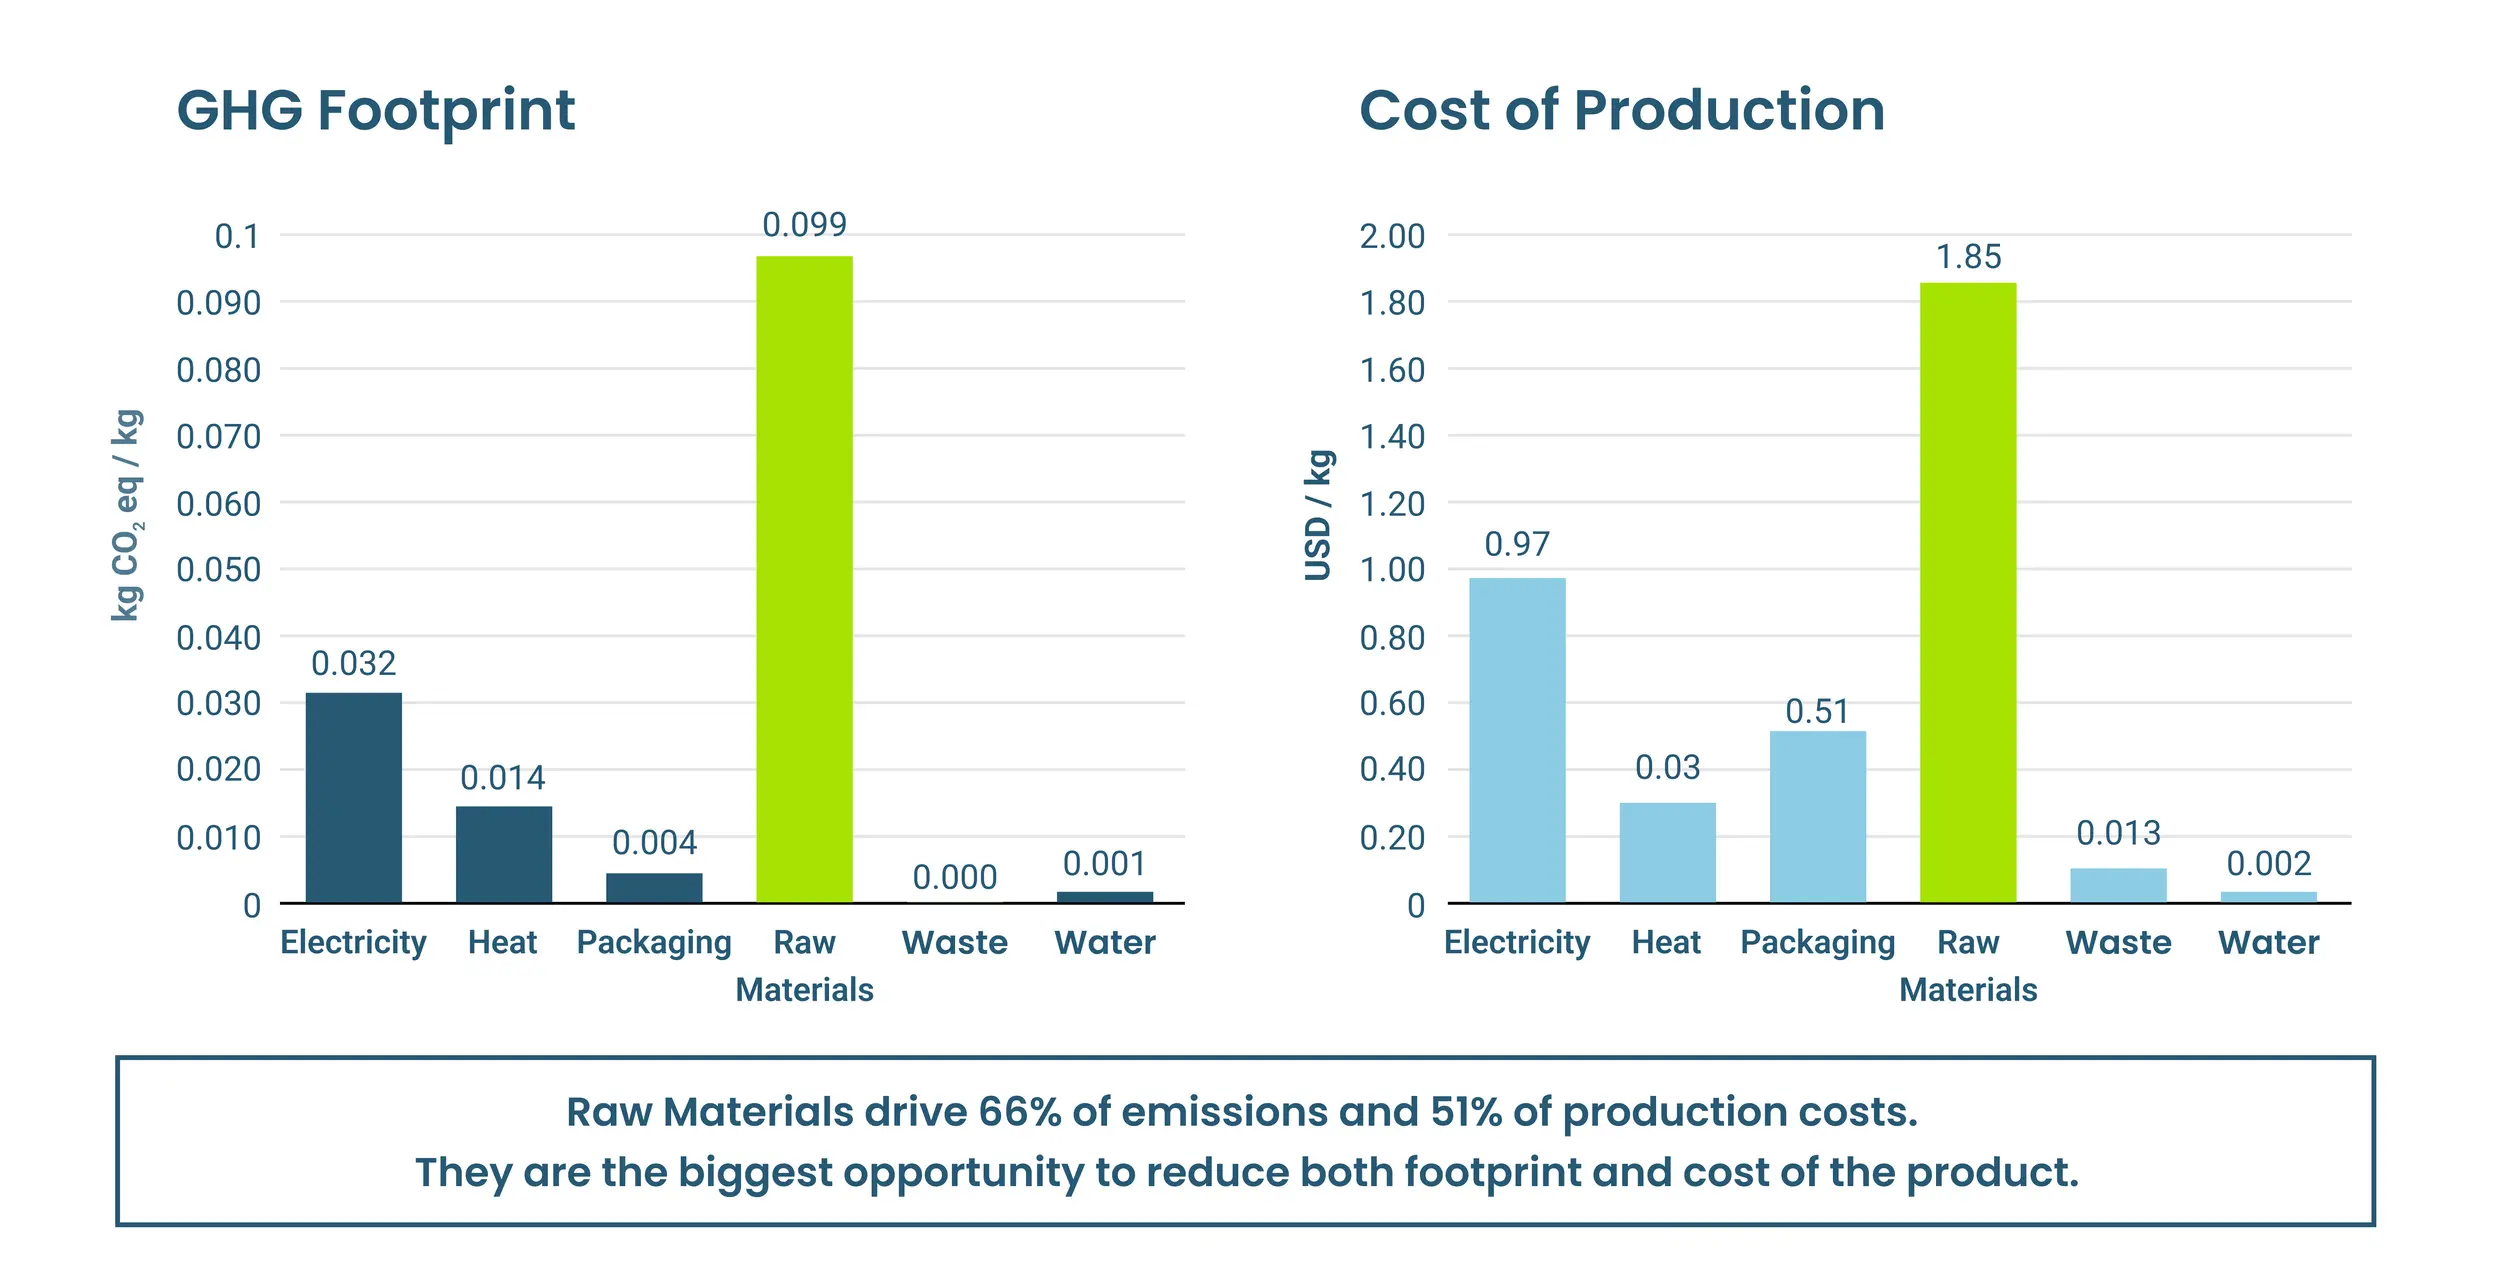
Here is the commercial part: when the model shows one process driving a large share of the sustainability footprint, it is usually pointing at a large share of cost as well. Energy, materials, transport, and waste sit in the footprint and in the budget together.
A hot spot shows engineers the one place where a single change improves sustainability and cost margin at once, so improvement effort stops being guesswork.
-opt-2500.WEBP)
Detecting Hidden Risks
An LCA follows every input back to its source, surfacing dependencies that purchasing records never show. A material with a friendly price tag can carry an unfriendly sustainability footprint, arriving from far away or leaning on an energy source that undercuts your product's environmental impact. The dependency can be financial too: if one input makes up most of a product's cost, a price swing in that input lands directly on margin.
These blind spots matter more every year. Procurement teams increasingly expect suppliers to show a documented sustainability footprint, and a company that gets challenged on its own claims sends that pressure down its supply chain. Without visibility, you carry the risk twice over: in operations, where a hidden dependency can break, and in sales, where an unanswerable question can cost the deal. With visibility, each risk becomes a move you can make: a second supplier to qualify, a supplier conversation to have, a sourcing decision made with eyes open.
Adding the Cost Layer
The picture sharpens further when cost analysis joins the model. A Techno-Economic Analysis, or TEA, breaks your product's economics into the categories that drive them: materials, energy, labor, transportation, and capital costs. When sustainability and cost are combined in the same model, you can test a change before spending. You can try a new material or supplier as a scenario and watch both numbers respond. Some changes cut poor sustainability performance and cost at once. Others involve a genuine trade-off. In both cases, the sustainability and operations teams decide from one model, with no need to reconcile an LCA result against a separate cost estimate.
That is the pattern: find where the burden concentrates, see what it costs, test the fix before you commit. It is an operations discipline, and the LCA is the instrument that makes it possible.
We built LifeCycle IQ to make that discipline continuous. It combines ISO 14040/14044 compliant LCA models, custom-built per product by our research team, with cost analysis, supply chain visibility, and competitive benchmarking in one model that updates as your product changes. So the next sourcing question becomes a scenario you run, not a study you commission.
Want the full picture? Our new white paper, Sustainability Pays: How LCA Finds Cost and Risk in Your Supply Chain, walks through each of these ideas in depth, including how benchmarking shows where your product stands against the market. Download the white paper here.
Or skip ahead: book a short call with our team. We'll analyze your product, uncover hot spots and opportunities, and show what LifeCycle IQ can do for you. Contact us.


